The Revelator Trading Pro Momentum indicator presents market data in a smooth, easy to understand way. It does this by taking our Trend Pro algorithm and turning it into a pair of waves. The first wave is called the price wave. When price action turns bullish, the wave will point upward, break out of the oversold zone, cross above the zero line, turn green, and break into the overbought zone. Here is an example of this happening:
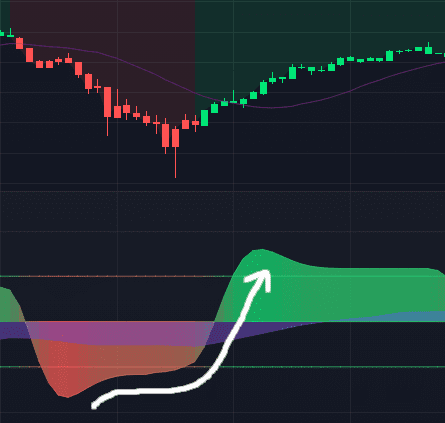
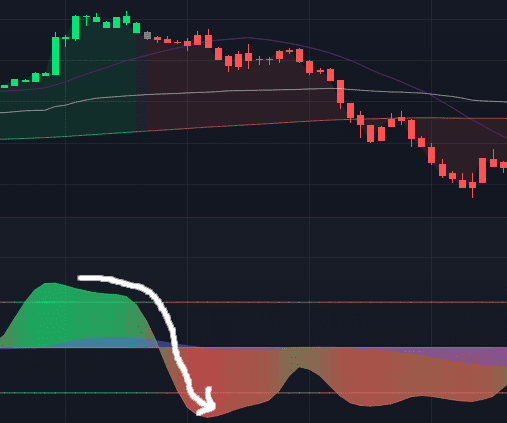
When the wave holds above the overbought zone, price action generally continues to be strongly bullish. Of course, all bull trends eventually run out of steam. When this happens, the wave will point down, break out of the overbought zone, cross below the zero line, turn red, and break into the oversold zone as pictured here:
Again, when the price wave stays below the oversold line, price action tends to be very bearish. The price wave gives the trader a very useful tool to gauge more immediate market sentiment. To help the trader see the bigger picture, a second wave called the momentum wave is provided.
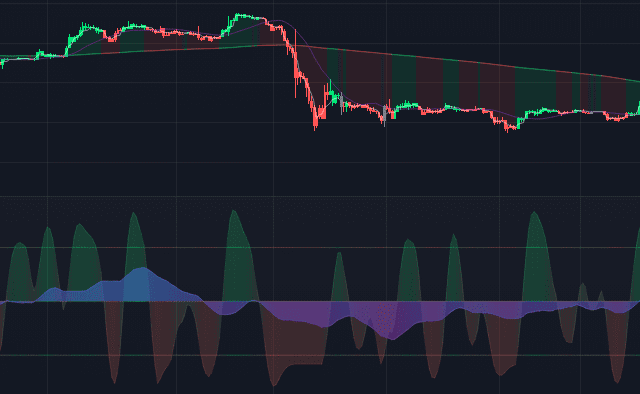
In the above image, the price wave is faded out to draw our attention to the momentum wave. When it points upward, crosses above the zero line, turns blue, and holds above the zero line, the asset will tend to have bullish momentum. In these conditions, long signals tend to have better probabilities. As momentum declines, the wave will turn downward, cross below the zero line, turn purple, and hold below the zero line. This is when probabilities tend to favor shorting. The momentum wave can be thought of as the tide – when it comes in, all boats rise, when it leaves, they all drop.
One of the easiest ways to use the Pro Momentum indicator is to use the above information to filter the signals generated by the Trend Pro indicator. Let’s say Trend Pro is suggesting to go long. Now look at Pro Momentum and consider using one or more of the following as a filter:
- Is the price wave and/or the momentum wave pointing up?
- Is the price wave and/or the momentum wave above the zero line?
- Has the price wave recently broken out of the overbought/oversold zone?
- Is the price wave holding the overbought/oversold zone?
Divergences
Divergences are the silver bullet that many proponents of momentum indicators always like to tout. Pro Momentum does produce divergences, and these divergences can provide leading indication of market movements. Let’s look at some divergences:
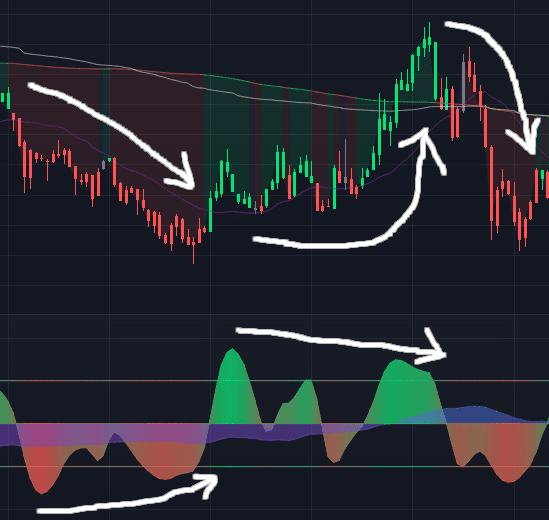
To begin our discussion, note how price action was trending down initially. If you look at the price wave on the Pro Momentum started trending up. This foreshadowed the bullish move to the upside. As the price action began to move upward, you’ll notice that the price waves began to trend downward, leading to the next dump. In both cases, momentum led price action.
Please note that divergences don’t always play out in this fashion. The above is a cherry picked example. These often look amazing when you can see the whole picture after the fact. If you look carefully at the waves, you’ll notice divergences within the divergences that didn’t amount to much. Divergences usually need additional factors to increase the probability of them playing out in your favor. Look for volume spikes, wicks on the candles, key support/resistance levels, and fundamental analysis as forms of additional confirmation.
Time in the market usually trumps timing the market. Even though traders are often trying to time the market, they can benefit from this concept. When divergences present themselves, it is often worth entering with small position size, and a reasonably tight stop. If the divergence plays out, stops can be moved to break even, and winning trades can be added to as strong trends form. Frequent tiny losses, break even stops, and micro profits in this style of trading can be handsomely rewarded by the massive gains that powerful trends can give when they form.
Settings and Alerts
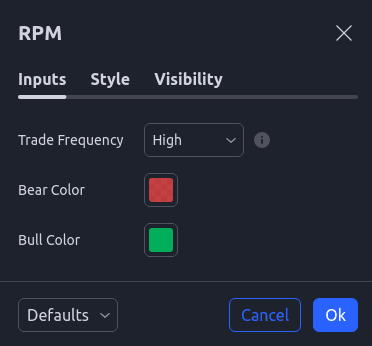
We like to keep trading simple, so there are very few settings to adjust. The trading frequency can be set to high, low, or medium. Cycling through these settings can give a more nuanced view of the asset. Lastly, you can fine tun the bull and bear colors.
Our Pro Momentum indicator can generate trading alerts that can be sent to your phone, email, or TradingView app. By using alerts, you can find other things to do besides watching unproductive charts. To set an alert, right click on the indicator, then select Add alert on RPM.


Once you’ve done that, this pop up will appear. For free TradingView plans, selecting the default Any alert() function call will use only one alert and make you aware of all conditions. If you wish to fine tune, you can choose to be alerted when the price wave crosses the zero line, breaks out of the overbought/oversold zones, breaks into the overbought/oversold zones, or when a pivot occurs in between those zones.
This summarizes the key functions and features of the Revelator Trading Pro Momentum indicator. Be sure to use the chart replay function of TradingView to gain experience in reading the price and momentum waves. Have any questions? Be sure to reach out to us by clicking the blue chat bubble in the lower right corner of the page.
